What Is Psychrometrics and Why Does It Matter?
Psychrometrics is the study of the thermodynamic properties of moist air. For HVAC technicians, it is one of the most essential branches of applied science. Every time a technician sizes equipment, diagnoses a comfort complaint, or evaluates system performance, they are working with psychrometric principles, whether they realize it or not. The psychrometric chart is the single most powerful tool for visualizing and solving these problems. It maps the relationships between temperature, moisture, energy, and volume of air on a single sheet of paper. Mastering this chart separates a competent technician from one who simply swaps parts.
The properties plotted on a psychrometric chart govern comfort, energy consumption, equipment selection, duct design, and indoor air quality. The chart is referenced throughout ASHRAE Handbook: Fundamentals, ACCA Manuals J, S, D, and T, and the testing protocols behind AHRI equipment ratings. Understanding how to read and apply it is not optional for professional HVAC work.
The Seven Properties of Moist Air
A psychrometric chart is a graphical representation of seven interconnected properties. If you know any two of them, you can determine all the others by locating a single point on the chart.
Dry-Bulb Temperature (DBT)
Dry-bulb temperature is the temperature of air measured by a standard thermometer shielded from moisture and radiation. It is the most familiar temperature measurement and forms the horizontal axis (x-axis) of the psychrometric chart. Values typically range from about 20°F to 120°F on charts used for comfort HVAC applications.
Wet-Bulb Temperature (WBT)
Wet-bulb temperature is the temperature measured by a thermometer whose sensing bulb is wrapped in a wet wick and exposed to airflow. Evaporation from the wick cools the bulb. The drier the air, the more evaporation occurs, and the lower the wet-bulb reading drops below the dry-bulb reading. On the chart, wet-bulb lines run diagonally from the upper left to the lower right, originating along the saturation curve.
Dew-Point Temperature (DPT)
Dew-point temperature is the temperature at which water vapor in the air begins to condense on surfaces. It is determined solely by the amount of moisture present. On the chart, dew point is read by following a horizontal line from the plotted state point leftward to the saturation curve, then reading the temperature at that intersection. Unlike wet-bulb temperature, dew point is not affected by evaporation rate.
Relative Humidity (RH)
Relative humidity is the ratio of the actual water vapor pressure in the air to the maximum (saturation) vapor pressure at the same dry-bulb temperature, expressed as a percentage. On the chart, RH is shown as a series of curved lines. The outermost curve on the left is the saturation curve, representing 100% RH. Lines for 90%, 80%, 70%, and so on curve inward to the right. A critical point: RH is temperature-dependent. Air at 90°F and 30% RH contains far more actual moisture than air at 40°F and 80% RH.
Humidity Ratio (W)
Humidity ratio (also called moisture content or mixing ratio) is the mass of water vapor per unit mass of dry air. It is expressed in pounds of water per pound of dry air (lbw/lbda) or, more commonly in HVAC fieldwork, in grains of moisture per pound of dry air (gr/lb). One pound equals 7,000 grains. Humidity ratio is plotted on the vertical axis (y-axis) on the right side of the chart. Because it is independent of temperature, horizontal movement on the chart (sensible heating or cooling) does not change the humidity ratio.
Specific Volume (v)
Specific volume is the volume occupied by one pound of dry air plus its associated water vapor, expressed in cubic feet per pound of dry air (ft³/lbda). On the chart, specific volume lines run diagonally, somewhat steeper than wet-bulb lines. Standard air at approximately 70°F and 50% RH has a specific volume near 13.5 ft³/lb. Technicians use specific volume to convert between mass airflow (lb/hr) and volumetric airflow (CFM).
Enthalpy (h)
Enthalpy is the total heat content of the air per pound of dry air, measured in BTU/lbda. It includes both the sensible heat (related to dry-bulb temperature) and the latent heat (energy stored in water vapor). On the chart, enthalpy lines run diagonally and are nearly parallel to wet-bulb lines. In fact, wet-bulb temperature and enthalpy lines are so close together that many charts use a single set of diagonal lines for both, with separate scales along the edge.
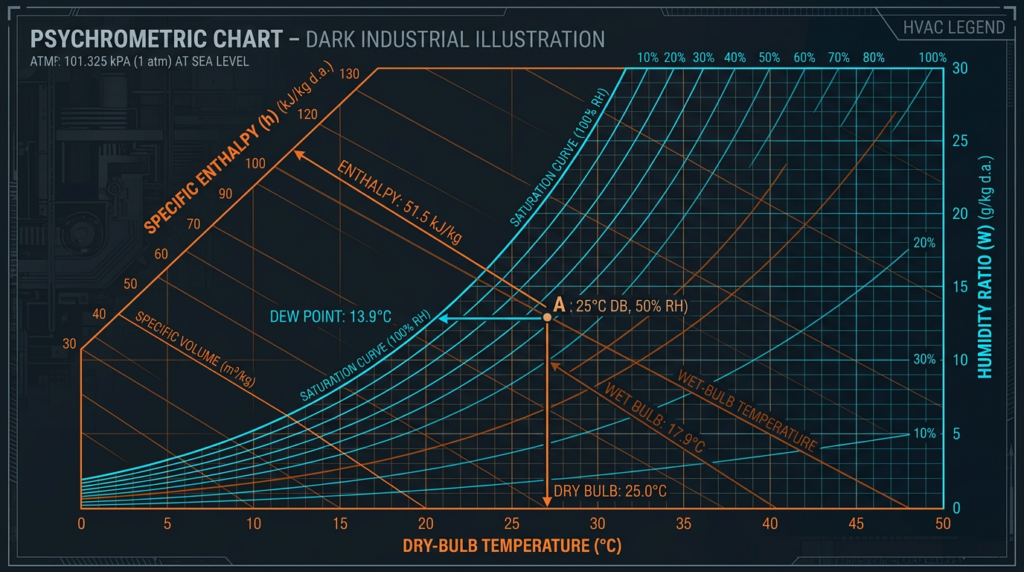
Reading the Chart: Locating a State Point
Every combination of air conditions corresponds to a single state point on the psychrometric chart. To find it, you need any two independent properties. The most common field measurements are dry-bulb temperature and either wet-bulb temperature or relative humidity.
- Find the dry-bulb temperature on the horizontal axis and draw a vertical line upward.
- Find the second known property (for example, 50% RH) and follow its curve.
- The intersection of these two lines is your state point.
- From that point, read all remaining properties: follow the horizontal line right to the humidity ratio scale, follow the diagonal down-left to the saturation curve for dew point, read the nearest enthalpy and specific volume lines, and follow the wet-bulb line up-left to the saturation curve for wet-bulb temperature.
For example, air at 75°F dry-bulb and 50% RH has approximately a 62.5°F wet-bulb temperature, a 55°F dew point, a humidity ratio of about 65 grains per pound (0.0093 lbw/lbda), a specific volume of 13.68 ft³/lb, and an enthalpy of 28.1 BTU/lbda.
Psychrometric Processes
HVAC systems move air from one state point to another. Each type of process traces a distinct path on the chart.
Sensible Heating
Passing air over a hot surface (heat exchanger, electric resistance element) raises the dry-bulb temperature without adding or removing moisture. The state point moves horizontally to the right. Humidity ratio stays constant, but relative humidity drops because warmer air can hold more moisture.
Sensible Cooling
Cooling air without condensation moves the state point horizontally to the left. This only occurs when the cooling surface temperature remains above the air’s dew point. Humidity ratio stays constant, but relative humidity rises.
Cooling and Dehumidification
When air contacts a surface below its dew point, both temperature and moisture content decrease. The state point moves down and to the left. This is the most common process in air conditioning. The apparatus dew point (ADP) is the effective surface temperature of the cooling coil. Not all air contacts the coil surface directly; some bypasses it. The ratio of bypassed air to total air is the coil’s bypass factor (BF). A typical residential cooling coil has a BF between 0.10 and 0.20, meaning 10% to 20% of the air passes through untreated.
Heating and Humidification
Adding heat and moisture simultaneously moves the state point up and to the right. Steam humidifiers in commercial systems are a common example of this process.
Evaporative Cooling (Adiabatic Saturation)
Evaporating water into an air stream cools the air while adding moisture. Because the energy to evaporate the water comes from the air itself, the process occurs at nearly constant enthalpy (and nearly constant wet-bulb temperature). The state point moves up and to the left along a wet-bulb line toward the saturation curve. Evaporative coolers in dry climates exploit this process.
Mixing of Air Streams
When outdoor air and return air combine in an air handler, the resulting mixed-air state point falls on a straight line drawn between the two individual state points. Its exact position depends on the mass flow rate of each stream. If 25% of the total airflow is outdoor air and 75% is return air, the mixed-air point sits 25% of the way from the return-air point toward the outdoor-air point. This graphical method is fast and accurate for field estimates.
Psychrometric Measurements and Instruments
Accurate field measurements are the foundation of all psychrometric analysis.
- Sling psychrometer: A pair of thermometers (one dry, one with a wet wick) mounted on a handle and whirled through the air. Simple and reliable when used correctly. The technician reads both temperatures after the wet-bulb stabilizes, typically after 30 to 60 seconds of rotation.
- Digital psychrometer/hygrometer: Electronic sensors measure temperature and humidity simultaneously and calculate derived properties. Professional-grade instruments cost between $150 and $400. They require periodic calibration, typically with a salt-solution test or manufacturer-supplied calibration kit.
- Data loggers: Placed in occupied spaces or ductwork, these devices record temperature and humidity over time, revealing patterns that spot measurements miss.
When taking measurements, avoid placing instruments in direct sunlight, near heat sources, or in stagnant air pockets. Allow sensors to acclimate to the environment for at least two to three minutes before recording values.
Practical HVAC Applications
Load Calculations
ACCA Manual J requires technicians to determine both sensible and latent cooling loads. Sensible load relates to dry-bulb temperature change; latent load relates to moisture removal. On the chart, the total cooling load corresponds to the enthalpy difference between the entering and leaving air conditions, multiplied by the mass airflow rate. Load calculation software (typically $500 to $2,000 for a license) automates this, but understanding the underlying psychrometric principles allows technicians to verify results and catch errors.
Equipment Selection
Manual S uses psychrometric data to match equipment capacity to calculated loads. An oversized air conditioner short-cycles, running for brief periods that cool the air (reducing sensible load) but fail to run long enough to adequately dehumidify (latent load remains). The result: a 74°F house at 65% RH that feels clammy. Proper psychrometric analysis prevents this.
Troubleshooting Common Problems
Consider a technician called to a commercial building where occupants complain of discomfort. The technician measures 78°F dry-bulb and 60% RH. Plotting this on the chart yields a dew point of approximately 62°F. If supply duct surface temperatures fall below 62°F (due to poor insulation or cold supply air), condensation will form on the ducts, potentially causing mold growth and water damage. The chart immediately reveals the root cause.
Other troubleshooting applications include:
- Frozen evaporator coil: Low return-air wet-bulb temperature combined with restricted airflow or low refrigerant charge drops the coil surface below 32°F, causing ice formation. Psychrometric measurements at the return and supply grilles quantify the problem.
- Excessive indoor humidity: Comparing indoor humidity ratio to outdoor humidity ratio reveals whether the moisture source is internal (cooking, showers, slab moisture) or external (ventilation air, infiltration).
- Dry winter air: Heating outdoor air at 10°F and 80% RH (humidity ratio near 8 grains/lb) to 70°F without adding moisture drops the RH to roughly 10%, causing discomfort and static electricity. The chart shows why humidification is necessary.
Commissioning and Energy Audits
During system commissioning, technicians compare measured psychrometric conditions at supply registers, return grilles, and outdoor air intakes against design specifications. Deviations indicate problems with airflow, coil performance, or control sequences. Energy auditors use psychrometric data to identify waste, such as excessive outdoor air intake or unnecessary reheat.
Altitude Correction
Standard psychrometric charts are based on sea-level atmospheric pressure (29.921 in. Hg or 14.696 psia). At higher elevations, atmospheric pressure is lower, and air is less dense. Denver, Colorado, at approximately 5,280 feet, has an atmospheric pressure near 24.90 in. Hg. Using a sea-level chart in Denver without correction introduces significant errors. ASHRAE publishes psychrometric charts for several altitudes (sea level, 2,500 ft, 5,000 ft, 7,500 ft). Digital psychrometric tools allow users to input the exact altitude for precise results.
Current Industry Changes Affecting Psychrometric Practice
SEER2 and HSPF2 Testing Standards
Since January 1, 2023, new residential HVAC equipment in the United States is rated under SEER2 and HSPF2 standards. These updated testing protocols use higher external static pressure (0.5 in. w.c. instead of 0.1 to 0.2 in. w.c.) to better reflect real-world duct system conditions. The psychrometric chart itself has not changed, but the equipment ratings derived from psychrometric test data have. A unit rated at 16 SEER may carry a rating of approximately 15.2 SEER2. This does not indicate reduced efficiency; it reflects a more realistic test.
Refrigerant Transitions
The EPA’s AIM Act is driving a phase-down of high-GWP refrigerants. R-410A, the dominant residential refrigerant for two decades, is being replaced by lower-GWP alternatives such as R-32 (GWP of 675) and R-454B (GWP of 466). Manufacturing and import restrictions for R-410A equipment take effect for many product categories in 2025. While these new refrigerants have different pressure-temperature relationships and slightly different enthalpy values at given operating conditions, the psychrometric properties of the air side remain the same. However, coil performance and dehumidification capacity may shift, making accurate psychrometric analysis even more important during the transition.
Energy Codes and Incentives
The IECC and ASHRAE Standard 90.1 continue to tighten energy requirements. Many jurisdictions now mandate minimum equipment efficiencies that exceed federal baselines. The Inflation Reduction Act (IRA) offers tax credits up to $2,000 for qualifying heat pumps and $600 for qualifying air conditioners, tied to SEER2 and HSPF2 thresholds. Technicians who understand psychrometric principles can verify that installed systems actually deliver the performance these incentives are meant to encourage.
Software and Digital Psychrometric Tools
Several software tools and mobile apps perform psychrometric calculations instantly. ASHRAE offers its own Psychrometric Chart app. Other popular options include Carmel Software’s Psychrometric Calculator and free web-based tools from major manufacturers. These digital tools offer advantages over paper charts: they handle altitude corrections automatically, calculate precise values without visual interpolation, and allow users to plot and save multiple processes.
However, digital tools have limitations. Without understanding the underlying principles, a technician cannot verify whether the tool’s output makes sense. A paper chart builds intuition. The best practice is to learn on the paper chart first and then use digital tools for speed and precision in the field.
Common Misconceptions
- Wet-bulb equals dew point: These are only equal at 100% RH (saturation). At any other condition, wet-bulb temperature is higher than dew point because evaporation from the wick depresses the wet-bulb reading only partway toward saturation.
- High RH means lots of moisture: Relative humidity is a ratio, not an absolute quantity. Air at 40°F and 90% RH holds about 37 grains/lb. Air at 90°F and 40% RH holds about 87 grains/lb, more than twice as much actual moisture despite lower RH.
- Psychrometric relationships are linear: The saturation curve is exponential. Doubling the temperature does not double the moisture-holding capacity. Always use the chart or validated software rather than straight-line interpolation.
- Rules of thumb replace calculations: The “400 CFM per ton” rule is a rough guideline for airflow, not a substitute for psychrometric analysis. Actual required airflow depends on the specific sensible and latent loads and the desired supply air conditions.
Key Takeaways
- The psychrometric chart plots seven properties of moist air. Knowing any two properties defines all the others.
- The saturation curve (100% RH) is the boundary of the chart. All real air conditions fall on or to the right of this curve.
- Sensible processes move horizontally. Latent processes move vertically. Most real HVAC processes involve both and move diagonally.
- Humidity ratio (grains or lbw/lbda) is the true measure of moisture content. Relative humidity alone can be misleading.
- Always use the correct chart for your altitude, or use digital tools with altitude input.
- Accurate field measurements with properly calibrated instruments are essential. Digital psychrometers ($150 to $400) are the standard field tool.
- New efficiency standards (SEER2, HSPF2) and refrigerant transitions (R-410A to R-32/R-454B) do not change the psychrometric chart, but they change the equipment performance data that technicians must evaluate against it.
- Learn the paper chart first. Use software for speed. Never trust a number you cannot verify with fundamentals.